Author name: SarveshD

Blog

Blog: Bullets from the Clouds – The first principle view for Industrial Automation

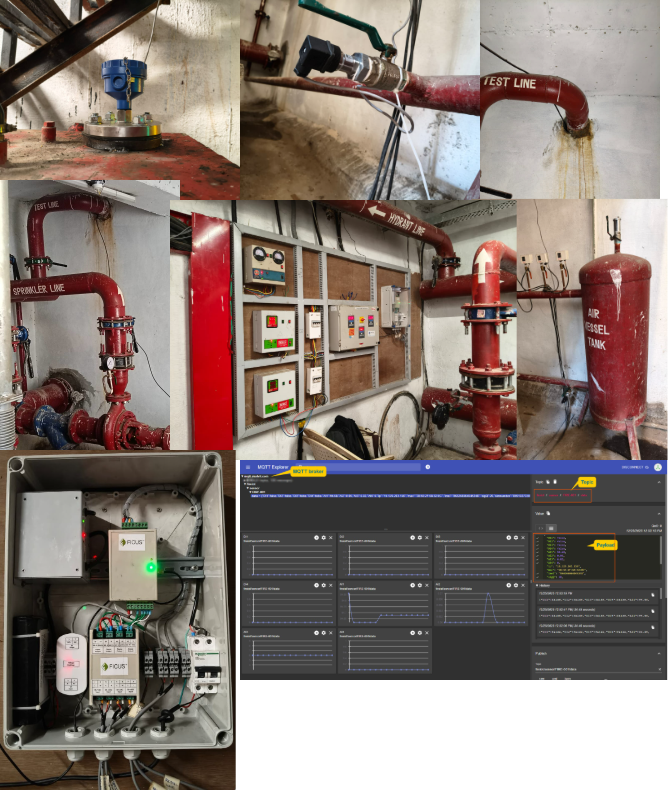
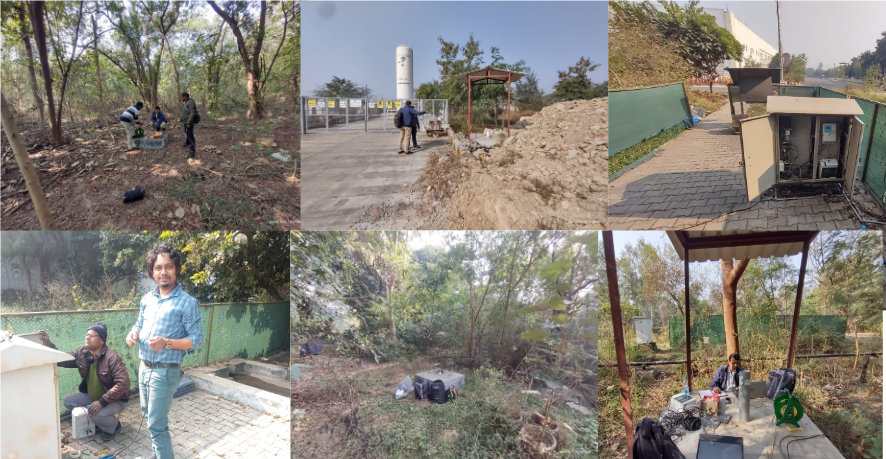
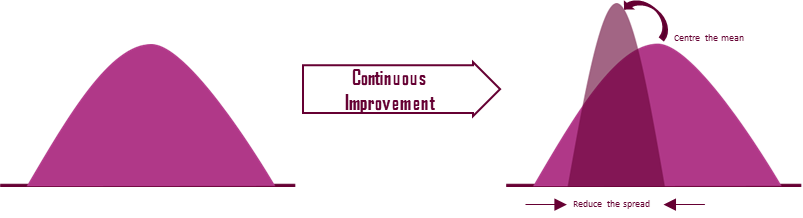
Recently, we were engaging with a client for automating their existing production line. This essay is built on some of the discussion we had with their team, which consisted of shop floor engineers, consultants, people from finance and higher management. Though the client aggressively wanted to pursue automation, as consultant, it was important to drive the conversation so that all stakeholders were on the same page i.e. the management should have similar appreciation of the challenges which may be obvious to the process or instrumentation engineers. While the client discussion happened over several meetings, the overall perspective on how we approach process automation guided by ‘first principles’, makes an interesting topic worth elaborating. The bullets in my title are not the bullet points of some presentation on best practices of using cloud infrastructure for automation. The bullets I refer to are the fast-moving projectiles and the clouds are the clouds that you see when you look up to the sky. If you want to develop ability for ‘first principle thinking’, you will have to keep revisiting basic mathematics and laws of physics. Coming back to the cloud, lets revisit 9th grade physics and mathematics. The laws of motion: v = u + at s = ut + ½ a t2 , so v = (2as) 1/2 If a cloud is at a height of 10,000m a simple calculation, using acceleration due to gravity as 9.8m/s2 and starting velocity (u) as 0, shows that the speed of the rain drop by the time it reaches ground level would be 447m/s or 1610kmph or 1.34 Mach (1.34 times the speed of sound). At 447m/s the rain drop would be at the speed of a typical bullet fired from a handgun. And that’s when it starts at 10,000m. There are clouds even higher. Essentially life on earth as we know it, both plant and animal would not exit if rain drops hit the surface at that speed. However, raindrops fall at under 10m/s, mostly at 2-5m/s. Well, as we all know, that’s because of ‘drag’ or friction in the opposite direction from the air. In fact, the drag force is proportional to the square of the velocity i.e. they increase rapidly as the velocity increases and at one point the force from gravity is balanced by the drag force and the falling object stops acceleration i.e. it reaches what is called Terminal Velocity. Acceleration = g – α v2, where α is some factor. The graph below is constructed by a XLS simulation. Give the values of acceleration due to gravity and the drag force, regardless of the initial velocity, 0 or say 300, the object will tend towards a stable velocity. First Principle Thinking So, what exactly is the First Principle Thinking here and how does it apply to Industrial Automation. The most basic mechanism to understand here in ‘the closed loop feedback’, especially the ‘negative feedback’ of the closed loop. Any stable system would have a negative feedback loop. This is a very general principle that we can see in various places around us, both naturally occurring as well as in systems designed by humans. There are potentially limitless examples of a self-regulating closed negative feedback loop in nature. As engineers, we design systems in similar ways. The most basic examples being: There are other examples in society too, like Awareness of these fundamental principles can help us define the situation in a more precise manner which in-turn helps to communicate to a diverse set of stakeholders a singular view of what the group needs to achieve. The wider perspective also opens the possibility of innovation by ‘transfer learning’ i.e. ability to apply general principles from one domain to another. Future innovations are increasingly going to come from those who are able to see and relate across multiple domains.  Industrial Automation I have already listed some engineering scenarios that are fundamentally a ‘closed loop negative feedback system’ and when precisely engineered, bring stability and predictability to industrial system. A client in Chemical Process industry wants to automate their entire production. The vision was to move towards a ‘Dark Factory’ i.e. totally automated and with no need for any human intervention, you don’t need any light in the factory. Our discussions with the production engineers ultimately lead to the question ‘How to stabilize’ a process? To stabilize without constant human monitoring. By now the answer is obvious – we need to implement a ‘closed loop negative feedback system’ across the plant. The basic problem, however, was that the output cannot be tested real-time. The production was a continuous process and from time to time a sample would be drawn and sent to the laboratory for testing. The lab testing itself took few hours for the results. Clearly a closed loop self-correcting system was not possible. How do we approach this problem? Since a closed loop system was not possible, let’s look at typical ‘Open Loop’ system. 2. Unstable System: Unstable open loop processes are those whose output values are not bound by input and therefore may run away on either side. Typical example would be exothermic reaction leading to an explosion or even a nuclear chain reaction. AI/ML and the Pseudo Closed Loop. The way to automate such processes is through establishing empirical, data driven relationship. Enter Regression Analysis Time series data was collected on various parameters and a regression analysis (OLS – Ordinary Least Square) was done. The R-squared values helped identify which of the independent variables had the most impact on the dependent variable, which in this case was one specific parameter(Y) of the end product. Y = β0 + β1X1 + β2X2 + β3X3+……. + βpXp + ε Putting together the two concepts together By stabilizing the input (say temperate by using a thermostat) we can try to keep the output within a narrow limit. Using Sisai’s Ficus range of edge devices and the CrowSensor platform we can implement a pseudo closed loop process control system that would

Blog

Case Study: Real-Time Monitoring Solution for Water Level, Water Flow, Pressure, Diesel Level & Fire Hydrant Systems

Client Overview The client operates a critical infrastructure facility with fire-fighting and utility systems comprising water storage tanks, diesel storage for generators, and pump rooms with multiple electrically driven pumps. Continuous visibility of water availability, diesel levels, pump status, and pressure conditions was essential for operational readiness, compliance, and preventive maintenance. The client required a reliable IoT solution capable of acquiring sensor data, monitoring digital inputs, and securely transmitting validated data to their backend system. Project Objectives Solution Design Key Deliverables Value Delivered to the Client Conclusion The project successfully delivered a robust IoT monitoring solution that transformed manual, fragmented monitoring into a centralized, automated, and reliable system. The integration of sensors, digital inputs, and MQTT-based data transmission provided the client with actionable insights, improved system availability, and long-term operational confidence.

Blog

Case Study: Real-Time Ground Water Level Monitoring Solution for Tata Motors, Lucknow

Introduction The Central Ground Water Authority (CGWA) mandates that all industrial and commercial establishments in India extracting significant amounts of groundwater must both secure a valid NOC and report groundwater usage regularly. This includes installation of observation wells (piezometers) and uploading of groundwater level data to the CGWA web portal. Manual reporting can be time-consuming and prone to errors, especially for large manufacturing sites. Problem Statement Tata Motor’s Lucknow plant specializes in the manufacture of a wide range of commercial vehicles.  They have six borewells distributed across its large campus. They extract ground water for their industrial usage. As per the CGWA mandate, they need to monitor ground water usage and upload their report to the government portal. Image 1: Above image shows some of the borewells inside the campus Previously, the groundwater level at each borewell was measured manually: Measurement is done at Peizometer Borewell. It is a narrow diameter borehole drilled to the required depth. It is normally drilled at a small distance from the borewell Pump used to extract the water. Service personnel visited each piezometer borewell, used a manual device to check water levels, and recorded the readings on paper. The data was later manually entered into the system and uploaded to the CGWB portal. Image 2: Above image shows piezometer borewell and the piezometer for manual measurement Challenges The manual process was labor-intensive, especially with borewells spread across remote parts of the campus. High risk of errors, missed readings, and data manipulation. Compliance with regulatory requirements became cumbersome. Data entry was repetitive and inefficient. Tata Motors sought an automated and reliable solution to streamline and improve the process. The Solution Sisai Technologies implemented an IoT-based real-time ground water level monitoring system for all six borewells at Tata Motors Lucknow. Solution Infographics  Diagram 1: Above diagram shows solution infographic. How It Works Sensor Installation: Hydrostatic level sensors are placed in the piezometer borewells. Data Collection: Sensors send readings to their respective transmitters. Centralized Aggregation: The Ficus Weblogger device aggregates incoming data from all six borewells. Automated Reporting: The daily data file (named as per Tata Motors template, timestamped) is automatically uploaded after 00:00 hours to the designated FTP server. Core Solution Features Hydrostatic Level Sensors (Piezometers): Installed in each borewell, these sensors measure water levels continuously and accurately. Transmitters: Each sensor is connected to a surface transmitter that supplies power and relays data to the central device. Ficus Weblogger (Edge Computing Device): Serves as the heart of the system. It receives SMS messages containing readings from each borewell, collates and formats the data, and generates a daily report file. Sample Reading timestamp,bw_name,bw_reading,bw_temp,bw_health “20/12/21,11:22:56”,bw_04,6.15,21,Good “20/12/21,12:24:18”,bw_04,6.12,21,Good “20/12/21,13:26:32”,bw_04,6.09,21,Good “20/12/21,13:50:33”,bw_04,6.09,21,Good “20/12/21,14:52:47”,bw_04,6.06,21,Good “20/12/21,15:27:37”,bw_05,10.64,22,Good “20/12/21,15:30:01”,bw_05,10.64,21,Good “20/12/21,16:32:16”,bw_05,10.78,21,Good “20/12/21,16:53:37”,bw_03,49.95,25,Good “20/12/21,16:56:24”,bw_03,49.95,24,Good “20/12/21,16:53:37”,bw_03,49.95,25,Good Sr. No. Field Description 1. Time Stamp Time stamp of data reading 2. Borewell Name Name of borewell 3. Ground water level Water level from the ground in meters. 4. Temperature Ambient temperature. 5. Health Overall ground water level health.  Note: There is no absolute value that defines “healthy” groundwater. CGWB classifies groundwater as “Safe” if extraction is less than 70% of natural annual recharge in a given area. Benefits Delivered Automated collection eliminates manual errors and risk of data manipulation. Direct, automated upload ensures adherence to regulatory mandates (CGWA/NOC requirements). Continuous, detailed groundwater level tracking helps Tata Motors proactively manage water usage and sustainability goals. Eliminates repetitive, error-prone manual tasks. Field Installation Image 4: Above image shows some field implementation photographs Summary Sisai Technologies’ IoT ground water monitoring system at Tata Motors Lucknow delivers real-time, accurate, and regulation-ready ground water data across all industrial borewells. The solution streamlines compliance, enhances data accuracy, and empowers proactive resource management—demonstrating the value of digital transformation for industrial sustainability and regulatory excellence.

Blog

IoT Solution for Chiller Condition Monitoring

1.      Executive Summary Parameter Before Dec 23 After June 24 Change  Avg. SPC (KW/TR) 0.775 0.665 ↓14.3% Avg. Power (KW) 162.83 139.56 ↓14.3% Cooling Capacity (TR) 180.51 217.28 ↑20.4% Avg. COP 4.0 5.5 ↑37.5% Note: 2.      The Challenge Challenge: Key Pain Points: Solution: Deployment of custom Ficus IoT data acquisition devices, seamlessly integrated with existing PLCs, to enable real-time condition monitoring. Data was visualized through the Crowsensor dashboard, providing actionable insights for operators and management. Outcome: 3. The Solution IoT-Based Chiller Condition Monitoring Chiller performance monitoring was achieved by capturing and analyzing key operational parameters, such as: These derived metrics were calculated from raw data sourced from: Sample Data Points Acquired Below table shows some of the parameters out of several data points being acquired. Parameter Details  Water Inlet Temperature Unit: °F Condenser Inlet Water Temperature Unit: °F Refrigerant Level Unit: % Inlet Guide Vane Unit: % Suction Pressure Unit: PSI Cavity Temperature Unit: °F Loading Status Unit: % Compressor Run Hour Unit: Hr Evaporator Approach Unit: °F  Power Unit: kW Compressor Inverter Temperature Unit: °F Solution Architecture Image 1: Above image shows the solution architecture Ficus IoT devices interfaced directly with the chiller PLCs and ancillary sensors, transmitting data to an on-premise server for secure processing and storage. The Crowsensor dashboard provided intuitive, real-time visualization and analytics. Technical Highlights Image 2: Above image shows the Chiller PLC panel   Image 3: Above image shows the Ficus Device Installed on the Chiller Panel Data Visualization Image 4: Above image shows the dashboard screenshot Image 5: Above image shows the dashboard screenshot 3.      Results & Measurable Impact Post-Intervention: SPC stabilized below 0.70 KW/TR Figure 1: Monthly SPC trend with inefficiency threshold (0.75 KW/TR) Figure 2: Power consumption versus cooling capacity trend Key Outcomes: Figure 3: Monthly COP and EER trends with minimum threshold Potential Cost Savings Annual Savings = ∆Power × Hours × Rate = (162.83 − 139.56) × 8,760 × 10 = Rs. 2,037,492 Note: Actual cost saving may vary depending upon conditions on ground. 4.      Why This Matters for Other Manufacturers Conclusion:By leveraging Sisai IoT technology for real-time chiller monitoring and analytics, the customer transformed their maintenance strategy from reactive to predictive, significantly reducing costs and improving operational resilience. This case demonstrates the tangible benefits of IoT-driven optimization for large-scale manufacturing environments Contact us for discussions +91 9284255899 Contact@sisaitechnologies.com

Blog

Understanding Industrial Automation

Any typical industry today comprises many processes with different complexity. These processes can be broadly divided into five logical levels. This categorization is done based on the nature and complexity of industrial processes. Although there is a lot of overlap between processes nowadays, the fundamental activities at each level remain the same. This can be visualized as a pyramid as shown in the image below. This is called as Industrial Automation Pyramid. Level 0: It gives a field-level view. This level directly works with machines operating on the floor shop. Sensors and Actuators are like the eyes and arms. One sensor just works with one variable. For example, a temperature sensor senses the temperature at one location. If there is a need to measure the temperature at multiple locations, many sensors have to be deployed. Similarly, one actuator controls one parameter alone. Level 1: It gives a machine-level view. A machine performs one unit of a task. For example, at a typical manufacturing shop floor, there are machines to perform tasks such as milling, grinding, drilling, cutting, etc. There are specialized controllers to control all functions of the machine as a single unit. These controllers internally use information captured by sensors and actuators to perform the task. In manual operation, an operator typically operates one machine and performs one task at a time. Level 2: It gives a process-level view. It’s an aggregate of tasks performed by individual machines at Level 1. Several machines performing their tasks in a sequence to achieve an output. For example, a block of steel will undergo several processes to take the shape of a gear. The outcome will be the final product or an unfinished component. Level 3: It gives a plant-level view. The typical plant consists of several processes such as raw material handling, machine job, paint shop, packaging, etc to convert raw material into a final product. In some cases, raw material could be components that are assembled into the final product. Level 4: It gives an enterprise-level view. It’s a top-level view that oversees and manages the complete business. Operations like manufacturing, sales, purchase, finance, and payroll come under this level. Flow of Information All levels are interconnected with the industrial communication system. When we go from level-0 to level-4, information gets aggregated. The level-0 and level-1 are time-critical activities. It’s a hard real-time system. Events and their response must happen in the allotted timespan. Response time is less than a second. Level 2 operates in a soft real-time manner. It has to complete under the allotted time slot but response time is not as stringent as level-0 or level-1. Processes involved in the lower three levels come under industrial automation. The top two levels come under information and communication technologies(ICT). There are many mature and robust applications, tools, and technologies to automate manual operations at all levels of any manufacturing industry. A discussion of individual technologies is out of the scope of this article. Roadmap for Automation Complete automation of any plant or factory or office cannot be done in one or two quarters. First, an automation roadmap has to be prepared. In the first stage, non-critical processes can be automated. Measure the benefit observed from automation. Then go for the next stage of automation. Automation includes training and skill enhancement of the existing workforce. Data collected from the bottom level is processed and analyzed by its next upper level. Processed information trickles up to the management. This is one of the benefits of automation. Accurate data from each level can be collected. This can be visualized and analyzed to derive business insight. Without basic automation, the Indian manufacturing industry can not adopt and benefit from advanced solutions such as Industry 4.0, predictive maintenance, and AI.

Blog

Data Acquisition Devices and Industry 4.0

Data Acquisition devices are used to collect physical condition data. This data is used for IIoT, Industry 4.0, and compliance purposes. Physical condition data comes from multiple sources: Process data from plant and machinery: Temperature, Vibration, Pressure, Speed, System uptime amp; downtime, Fuel level, etc  Physical Environment: Noise, pollution level, Humidity, Temperature, Liquid level, Light intensity, etc The data is collected using various sensors. Industrial equipment such as SCADA, PLCs, energy meters, etc generates various data points. Data is received in both analog and digital formats. DAQs process collected data and send them to the computer system for industrial and scientific usage. Modern DAQs are full-fledged systems consisting of HW and software applications. The software includes a dashboard to visualize the data received from HW. Various communication interfaces are included to handle data from multiple sources. With automation and Industry 4.0 taking center stage in the current industrial setup, the role of DAQ has increased manifold. DAQ Design Consideration The design and architecture of DAQ differ depending upon the application. Some important considerations:Type of data being collected: Physical property of the system being measured.Sensors being attached to it: How many sensors of what type are being connected to DAQ? External or internal sensors, the power source of sensors.Storage Media: RAM, EEPROM, USB, amount of storage, memory management.Data communication: Wired or wireless communication, different communication protocolData processing or filtering: Does data need some local processing or filtering, the microcontroller used, etc.Power source: Battery, AC, or DC supply.Usage: Use cases. Based on this, the enclosure or external packaging of the DAQ will be designed.The DAQ manufacturers need to design the system taking the above points into consideration. DAQ Block Diagram The diagram below gives a high-level view of DAQ. Detailing each step of data acquisition electronics is out of the scope of this article. Electronic Components such as multiplexers, Sample-Hold, Anti-Aliasing Filters are used in various combinations depending upon the architecture of DAQ. Many of the components are not shown for the sake of simplicity. Analog signals can be used directly for any practical purposes. Signals captured by sensors from the physical system or machinery are often weak and full of noise. Signal processing techniques are used to process and make them useful. This is done with the following methods:Signal Processing or Conditioning: Performs amplification, isolation, filtering, and linearization on the input signal.Analog to Digital Conversion: Converts analog signal into digital format.DAQ must read the signal at the right sampling frequency. The incorrect sampling rate may introduce low-frequency errors which will distort the original signal. Controllers used in DAQs are either: Microcontrollers: Common Industrial and commercial use cases.FPGA: High-end use such as Defence and critical scientific use cases. Data Acquisition Setup Capturing industrial data is the first step in the automation process. Industries that are going for automation and Industry 4.0 must plan and decide their data strategy. Stakeholders must devote some time to identify and select critical data points. Once, data strategy is ready, set up the correct infrastructure to collect and acquire data points. Data has to be adequate and accurate. Data accuracy is not possible without the correct design and implementation of data acquisition infrastructure.  Summary A wide variety of DAQs is available catering to all types of requirements. Industries can procure standard DAQs off-the-shelves which are adequate for most of the common use cases. DAQ manufacturers can manufacture customized DAQs as per the applications requirement. A well-planned data strategy along with robust and accurate data acquisition infrastructure will help industries achieve their Industry 4.0 goals.

Scroll to Top