1. Executive Summary
- 14.3% reduction in Specific Power Consumption (SPC)
- 20.4% increase in cooling capacity with 14.3% lower power usage
| Parameter | Before Dec 23 | After June 24 | Change |
| Avg. SPC (KW/TR) | 0.775 | 0.665 | ↓14.3% |
| Avg. Power (KW) | 162.83 | 139.56 | ↓14.3% |
| Cooling Capacity (TR) | 180.51 | 217.28 | ↑20.4% |
| Avg. COP | 4.0 | 5.5 | ↑37.5% |
Note:
- Above data points for the period between Dec 23 and June 24
- Chiller capacity: 115TR
- Customer: an Indian conglomerate making industrial tools and gadgets
2. The Challenge
Challenge:
- High energy consumption
- Degraded cooling capacity of the chillers
- Elevated operational costs.
- At one unit, operators were routinely operating both the main and backup chillers simultaneously during production to support the demand.
Key Pain Points:
- Excessive operational costs and energy waste due to suboptimal chiller operation
- Lack of real-time insights into critical chiller health parameters
- No automated system for early detection of inefficiencies or potential failures
Solution:
Deployment of custom Ficus IoT data acquisition devices, seamlessly integrated with existing PLCs, to enable real-time condition monitoring. Data was visualized through the Crowsensor dashboard, providing actionable insights for operators and management.
Outcome:
- Centralized, real-time operational visibility
- Optimized production processes
- Significant energy and cost savings
3. The Solution
IoT-Based Chiller Condition Monitoring
Chiller performance monitoring was achieved by capturing and analyzing key operational parameters, such as:
- Chiller Cooling Capacity
- Specific Power Consumption
- Coefficient of Performance (COP)
- Energy Efficiency Ratio (EER)
These derived metrics were calculated from raw data sourced from:
- PLCs
- Flow meters
- Energy meters
Sample Data Points Acquired
Below table shows some of the parameters out of several data points being acquired.
| Parameter | Details |
| Water Inlet Temperature | Unit: °F |
| Condenser Inlet Water Temperature | Unit: °F |
| Refrigerant Level | Unit: % |
| Inlet Guide Vane | Unit: % |
| Suction Pressure | Unit: PSI |
| Cavity Temperature | Unit: °F |
| Loading Status | Unit: % |
| Compressor Run Hour | Unit: Hr |
| Evaporator Approach | Unit: °F |
| Power | Unit: kW |
| Compressor Inverter Temperature | Unit: °F |
Solution Architecture
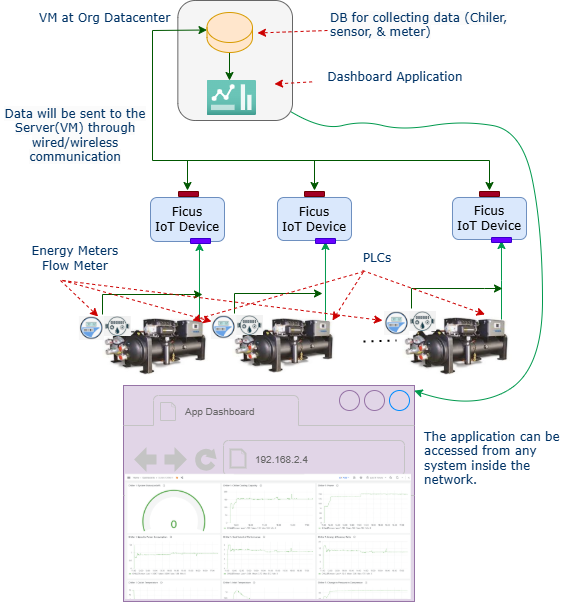
Image 1: Above image shows the solution architecture
Ficus IoT devices interfaced directly with the chiller PLCs and ancillary sensors, transmitting data to an on-premise server for secure processing and storage. The Crowsensor dashboard provided intuitive, real-time visualization and analytics.
Technical Highlights
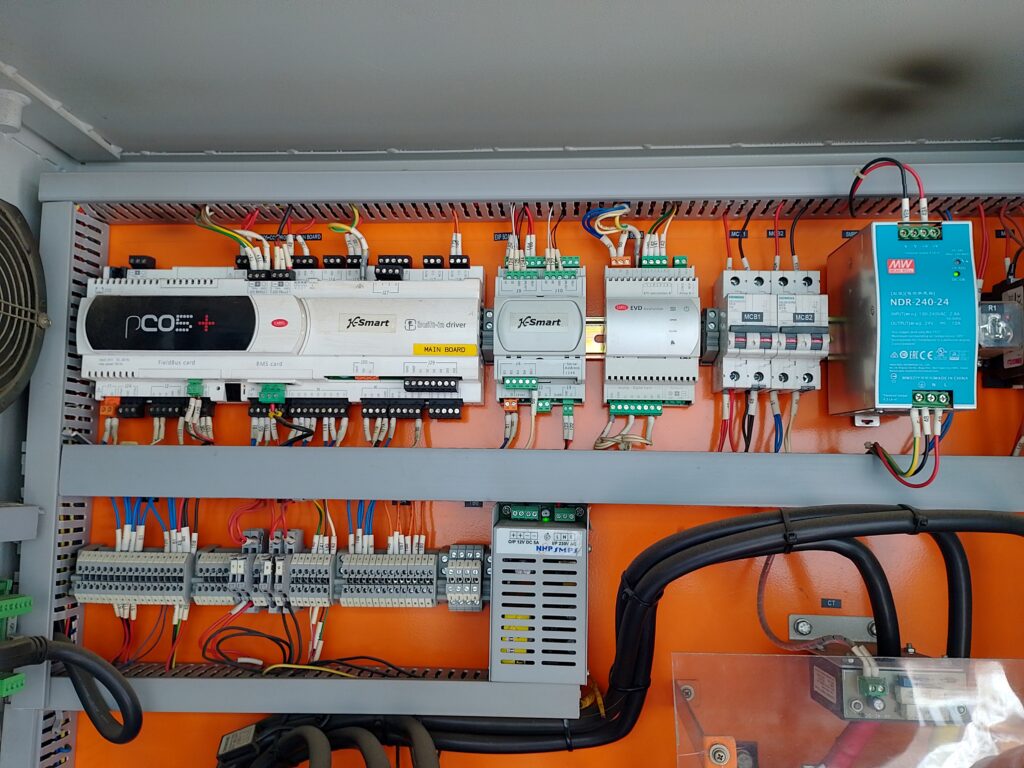
Image 2: Above image shows the Chiller PLC panel
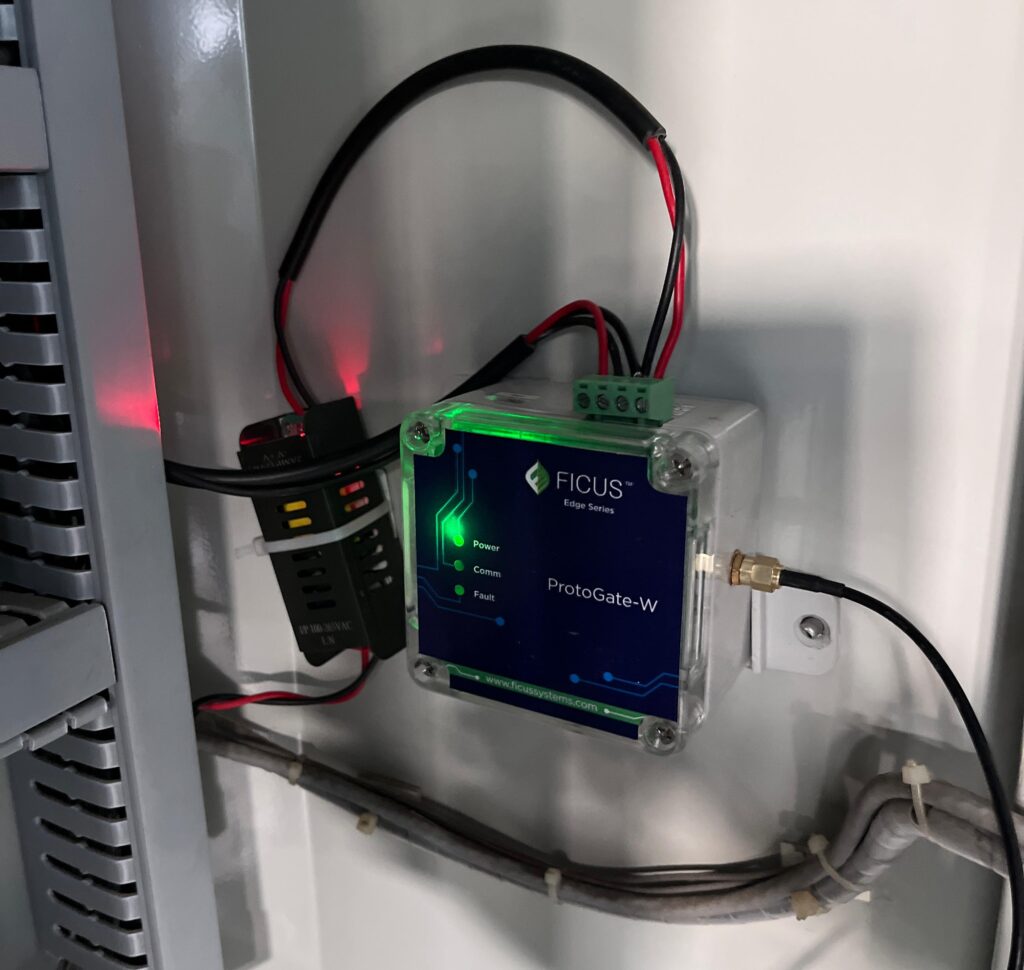
Image 3: Above image shows the Ficus Device Installed on the Chiller Panel
- On-Premise Hosting: Ensured data sovereignty and low-latency processing within the customer’s secure network.
- Custom Integration: Ficus devices adapted to legacy PLC protocols, eliminating the need for costly hardware upgrades.
Data Visualization
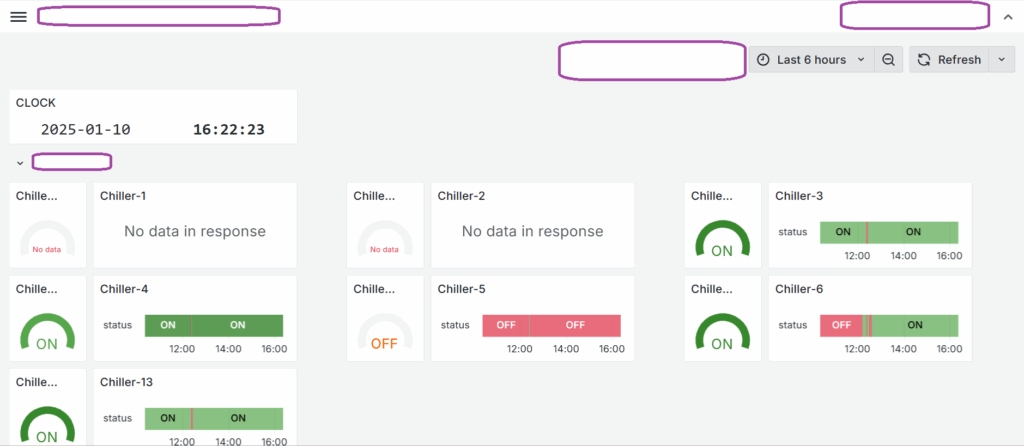
Image 4: Above image shows the dashboard screenshot
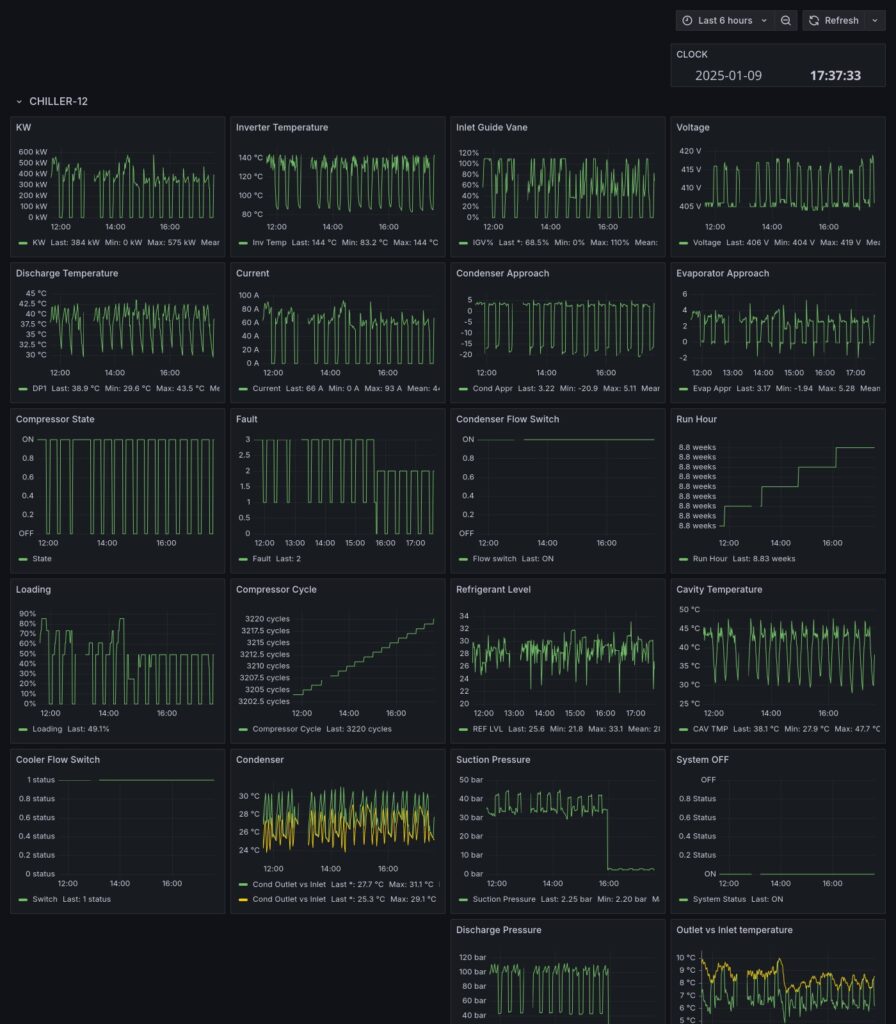
Image 5: Above image shows the dashboard screenshot
3. Results & Measurable Impact
Post-Intervention: SPC stabilized below 0.70 KW/TR
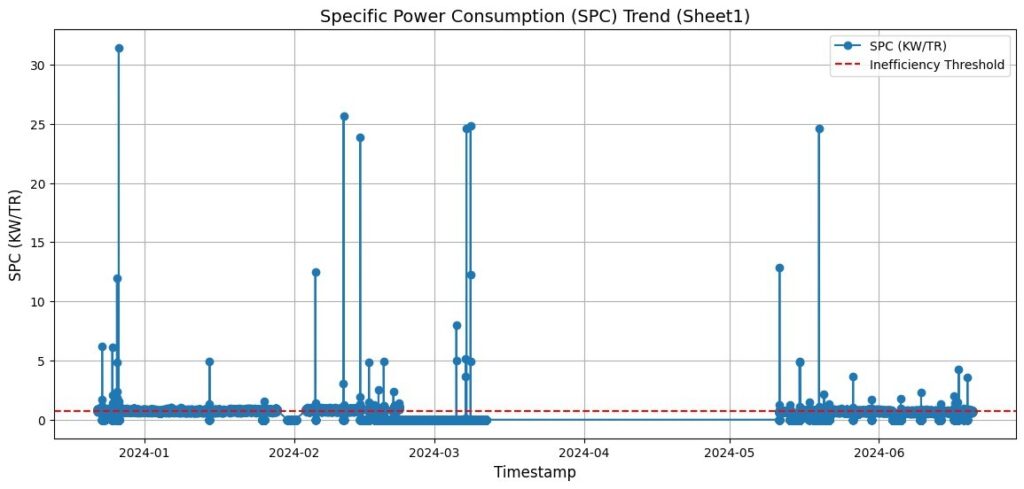
Figure 1: Monthly SPC trend with inefficiency threshold (0.75 KW/TR)
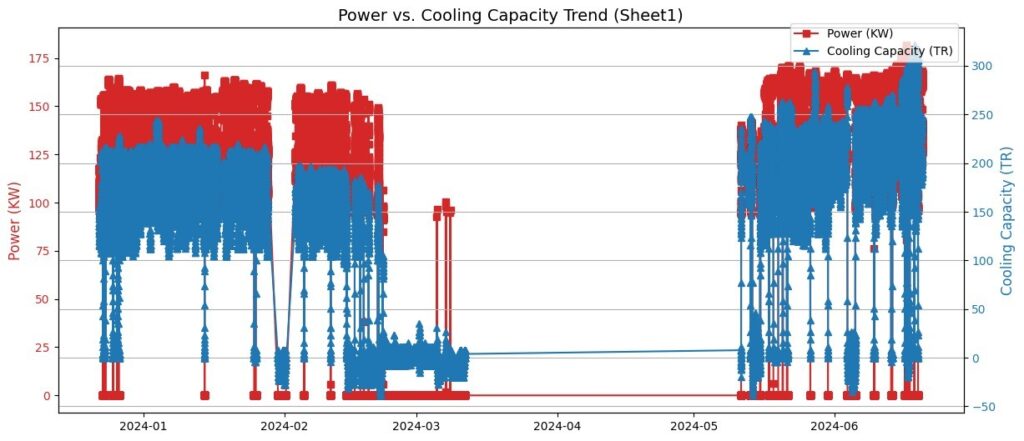
Figure 2: Power consumption versus cooling capacity trend
Key Outcomes:
- Predictive Maintenance: Chiller Cooling Capacity and Specific Power Consumption data gave important insight of Chiller performance.
- Energy Optimization: Setpoint recommendations resulted in energy savings.
- Operational Efficiency: Centralized dashboard reduced diagnostic time, streamlining maintenance and troubleshooting.

Figure 3: Monthly COP and EER trends with minimum threshold
Potential Cost Savings
Annual Savings = ∆Power × Hours × Rate = (162.83 − 139.56) × 8,760 × 10 = Rs. 2,037,492
Note: Actual cost saving may vary depending upon conditions on ground.
4. Why This Matters for Other Manufacturers
- Scalable & Adaptable: The solution can be extended to other HVAC assets, compressors, or pumps.
- Rapid ROI: Achieved a payback period of less than 12 months through operational efficiencies and energy savings.
- Compliance & Security: On-premise deployment ensures full compliance with industrial data governance standards.
Conclusion:
By leveraging Sisai IoT technology for real-time chiller monitoring and analytics, the customer transformed their maintenance strategy from reactive to predictive, significantly reducing costs and improving operational resilience. This case demonstrates the tangible benefits of IoT-driven optimization for large-scale manufacturing environments
Contact us for discussions
+91 9284255899
Contact@sisaitechnologies.com